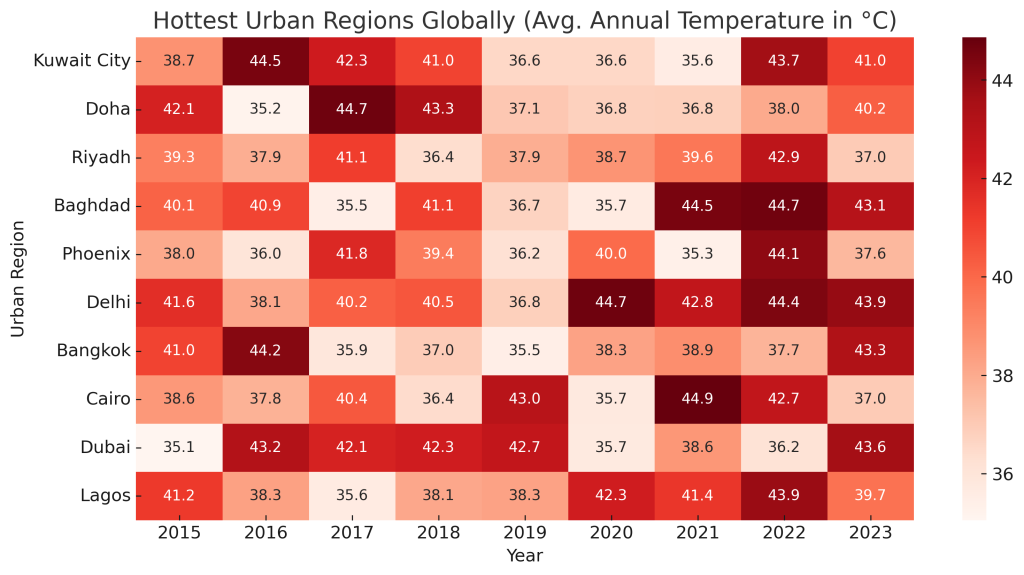
📊 Temperature Differences:
- Urban areas can be 7-10°C (12-18°F) hotter than rural areas.
- At night, cities retain more heat, leading to prolonged exposure to high temperatures.

🌆 Key Contributors:
- Dark Surfaces: Asphalt & concrete absorb and retain heat.
- Lack of Vegetation: Fewer trees reduce shade and evapotranspiration.
- Waste Heat: Air conditioners, vehicles, and industries release additional heat.
🔥 Health & Environmental Impacts:
- Increased heat-related illnesses and mortality rates.
- Higher energy demand for cooling, leading to more emissions.
- Worsened air pollution due to stagnant, hot air conditions.
Data Sources for Urban Heat Mapping
📡 Satellite Imagery & Remote Sensing:
- NASA’s Landsat & MODIS provide land surface temperature data.
- ESA’s Sentinel-3 tracks urban thermal variations.
🏙 On-the-Ground Temperature Sensors:
- IoT-based networks measure real-time urban temperatures.
- Citizen science projects allow individuals to contribute localized heat data.
📊 Machine Learning & AI for Heat Prediction:
- AI models use historical climate data to predict future UHI intensity.
- City-scale simulations test potential mitigation strategies.
Data-Driven Solutions for Cooler Cities
✅ Cool Roofs & Pavements: Reflective materials lower heat absorption.
✅ Urban Forests & Green Roofs: Increase vegetation cover to reduce heat.
✅ Smart City Planning: AI-driven models optimize tree planting locations and building orientation.
✅ Heat Action Plans: Data helps cities predict heat waves and prepare cooling strategies.
Conclusion
Urban heat islands are a growing climate challenge, but data-driven solutions can help cities adapt. By leveraging satellite data, AI predictions, and smart infrastructure planning, urban areas can reduce temperatures, improve air quality, and enhance public health.


